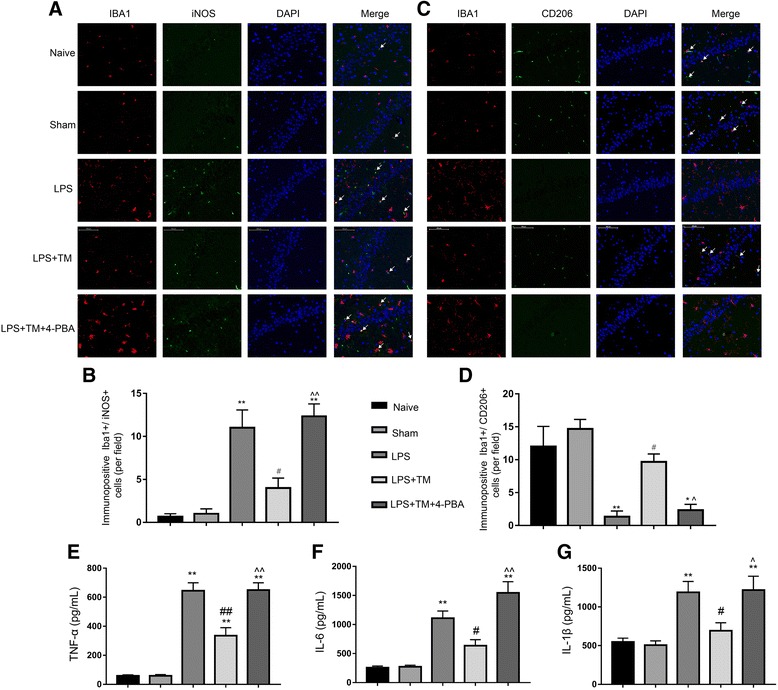
Fig. 6.

Mild ER stress contributed to M2a polarization in hippocampal CA1. a, b Double-staining immunofluorescence of IBA1 with either iNOS or CD206 in the CA1 area of the hippocampus (indicated by arrows). Scale bars, 100 μm. c Quantification of IBA1+/ iNOS+ double-stained cells in the hippocampal CA1. d Quantification of IBA1+/CD206+ double-stained cells in the hippocampal CA1. e, f, g. The levels of the proinflammatory factors TNF-α, IL-6, and IL-1β were detected by ELISA (n=5). The data are representative of three independent experiments. n = 6. *P < 0.05, **P < 0.01 vs. naïve group. #P < 0.05, ##P < 0.01 vs. LPS treatment group. ^P < 0.05, ^^P < 0.01 vs. TM treatment group. The data are presented as the mean ± SEM
