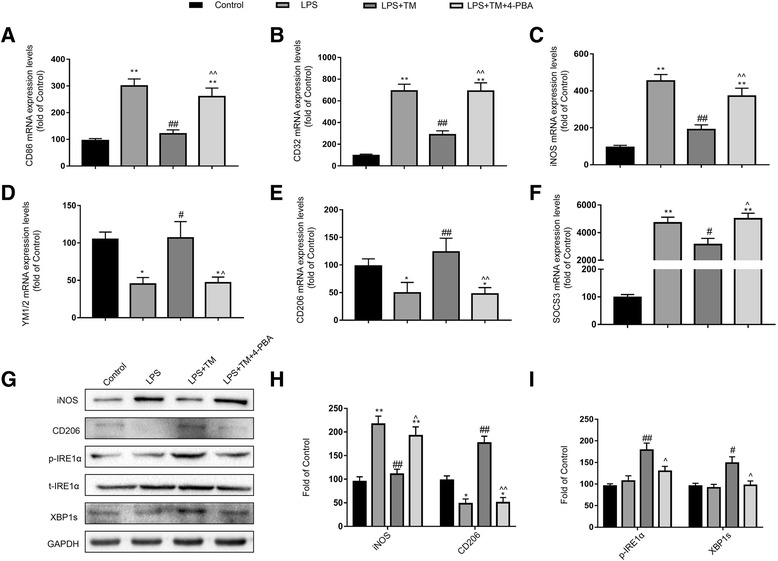
Fig. 9.

Mild ER stress induces microglial changes in polarization from M1/2b to M2a. a–c Expression levels of M1 phenotype markers (CD86, CD32, and iNOS). d, e Expression levels of M2a phenotype markers (YM1/2 and CD206). f Expression levels of SOCS3, a marker for the M2b phenotype. The expression levels of iNOS, CD206, p-IRE1α, and XBP1s were detected by Western blotting using specific antibodies in the primary microglia. Each blot is representative of three experiments. g, h, i Expression of p-IRE1α was quantified and normalized to t-IRE1α levels, and the expression levels of iNOS, CD206, and XBP1s were quantified and normalized to GAPDH levels. Each value is expressed relative to that in the control group, which was set to 100. All experiments were repeated three times. *P < 0.05, **P < 0.01 vs. naïve group. #P < 0.05, ##P < 0.01 vs. LPS treatment group. ^P < 0.05, ^^P < 0.01 vs. TM treatment group. The data are presented as the mean ± SEM
