
Fig. 2.
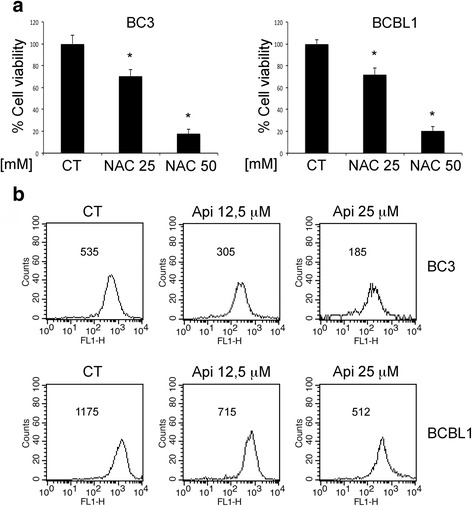
Apigenin reduces intracellular ROS. a BC3 and BCBL1 cells were treated with NAC at 25 and 50 mM for 24 h. Cell survival was assessed by trypan blue exclusion assay. The histograms represent the mean of the percentage of cell survival plus SD of at least three independent experiments. *p< 0.05. b PEL cell were treated with apigenin at 12,5 and 25 μM for 24 h. Intracellular ROS were evaluated by FACS analysis using DCFDA staining FACS plots are representative of three independent experiments. Numbers indicate the mean of fluorescence intensity. Means plus SD of three independent experiments are: BC3 CT 540 ± 31, BC3 Api 12,5 μM 313 ± 21, BC3 Api 25 μM 193 ± 20; BCBL1 CT 1185 ± 90, BCBL1 Api 12,5 μM 724 ± 52, BCBL1 Api 25 μM 525 ± 33