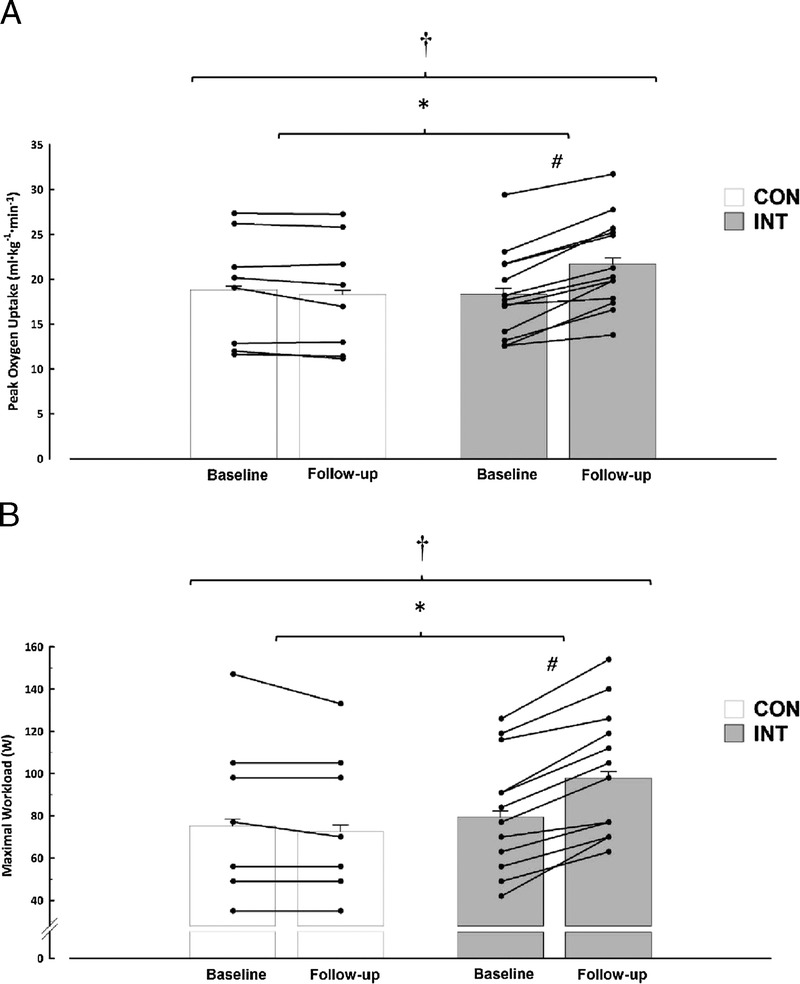
FIGURE 2.

V˙O2peak (A) and workload (B) at baseline and after 6 wk (follow-up) of CON or INT. Means ± normalized CI are shown. The CI values have been corrected to remove interindividual variation (22). †A main effect of day (i.e., baseline vs follow-up for both groups; P ≤ 0.001). *A day–group interaction (P ≤ 0.001). #Values are different pre–post within the INT group (P ≤ 0.001). There were moderate effect sizes between groups of d = 0.68 and 0.61 for V˙O2peak (A) and workload (B), respectively.
