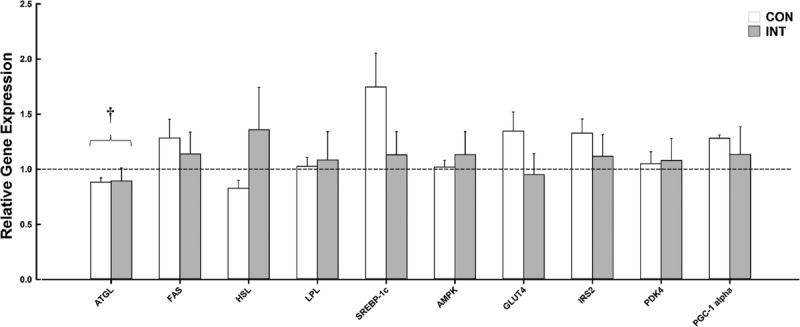
FIGURE 3.

Relative gene expression of 10 key metabolic genes measured in adipose tissue at baseline and follow-up for the CON group (n = 8) and the INT group (n = 12). Dashed line represents no change. Data normalized to PPIA, baseline, and internal calibrator. Sufficient RNA could not be obtained to carry out gene expression analysis for one participant follow-up sample (small adipose tissue yield); hence, n = 12 in the INT group. Values are means ± SEM. †A main effect of day (i.e., baseline vs follow-up for both groups; P ≤ 0.05).
