
FIGURE 2.
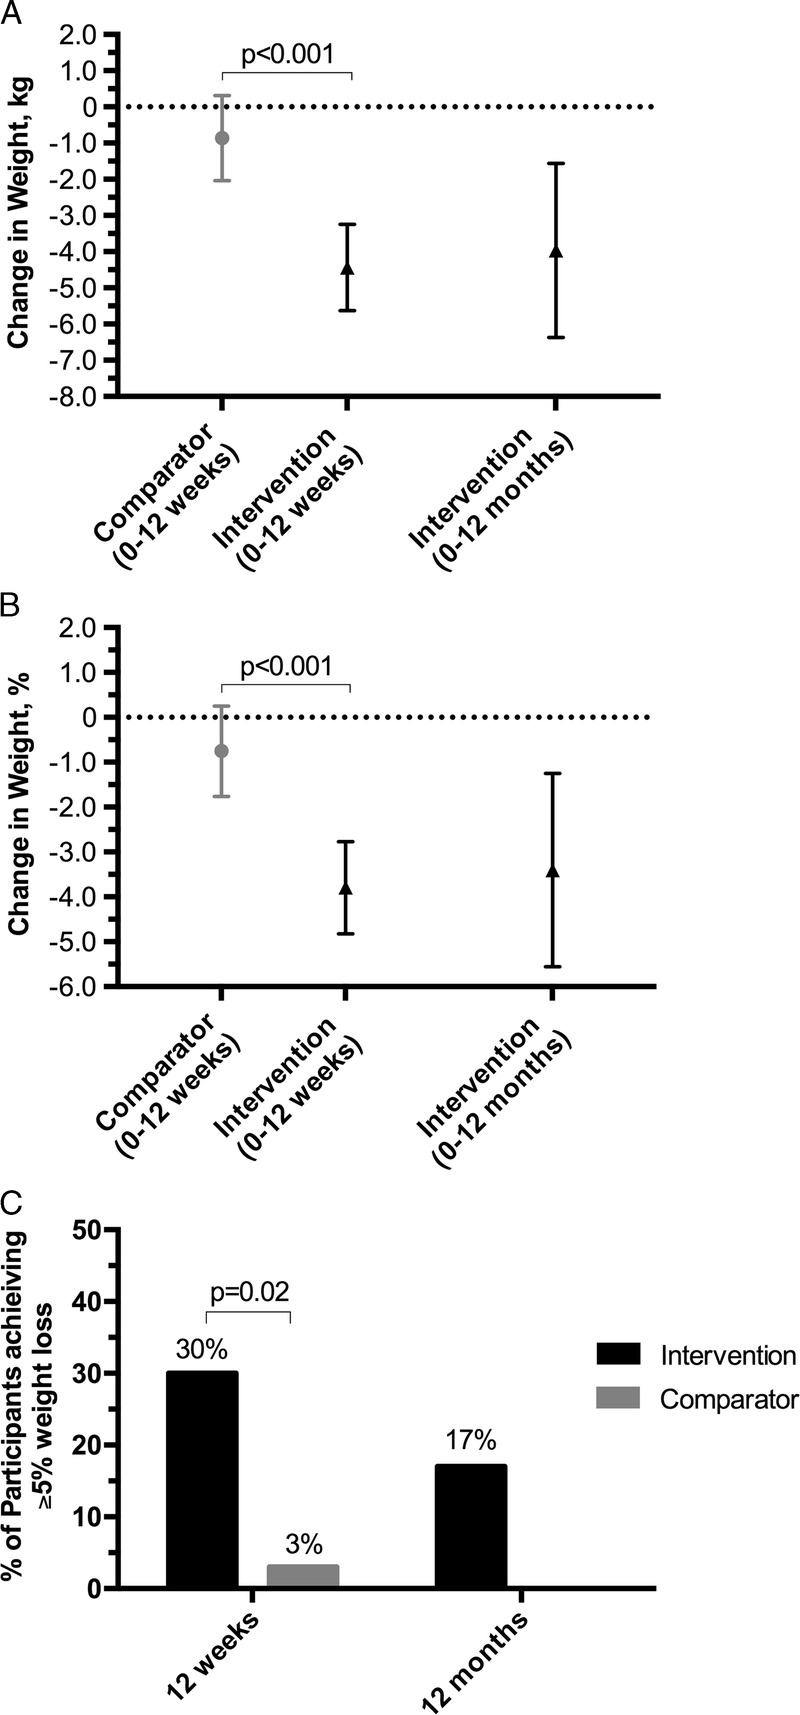
Effect of interventions on weight, percentage of baseline weight, and achieving clinically significant weight loss of at least 5%. A, Absolute weight change in kilograms. B, Percentage of baseline weight lost. C, Weight loss of at least 5% from baseline. From baseline (0 wk) to 12 wk, mean change in weight (kg) and percentage of baseline weight (%) were significantly different between the intervention and comparator groups—favoring the intervention group (i.e., greater weight loss and greater percentage of baseline weight lost). Within the intervention group, weight loss and percentage of baseline weight lost were maintained to 12 months. The intervention group had a significantly greater proportion of participants who achieved at least 5% weight loss by 12 wk compared with the comparator group. By 12 months, approximately half of the participants in the intervention group who had achieved at least 5% weight loss at 12 wk maintained this weight loss.