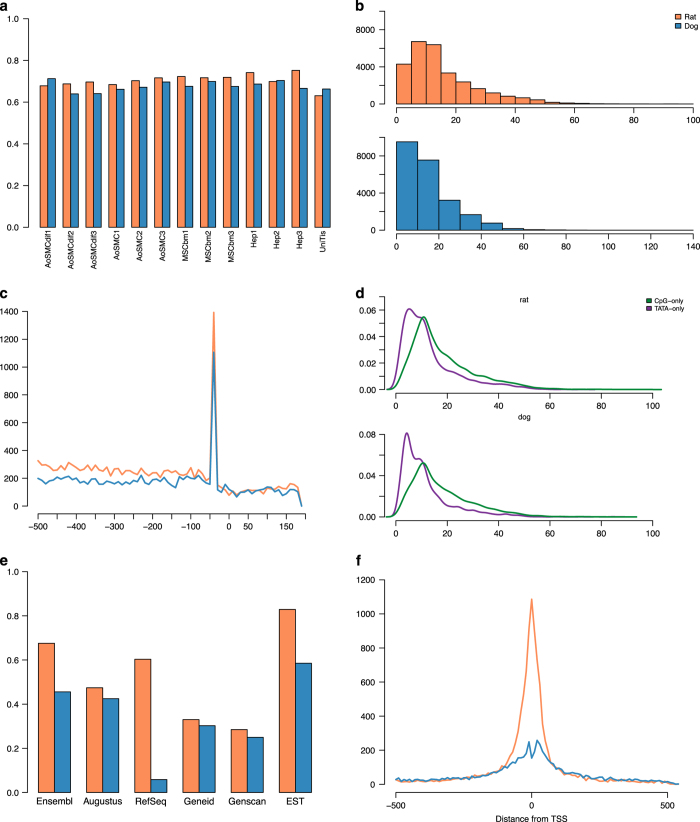
Figure 3. Characterization of CAGE peaks in dog and rat.
(a) Percentage of mapped reads at promoters identified by DPI for each sample. Labels description: AoSMC=aortic smooth muscle cell; AoSMCdiff=differentiated aortic smooth muscle cell; MESbm=mesenchymal stem cell from bone marrow; Hep=hepatocyte; UniTis=Universal tissue; (b) histograms of CAGE peaks lengths; (c) enrichment of TATA motifs near CAGE peaks; (d) graphs showing TATA-rich versus CpG-rich peaks. TATA-only bound CAGE peaks tend to be sharp whereas CpG-only peaks are generally broader; (e) percentage of genes that can be associated to a CAGE peak for each of the inspected known models; (f) distribution of the distances of CAGE peaks from their closest gene TSS. Colours: orange denotes rat and blue dog, except for (d), where colour-code is specified in the legend.

