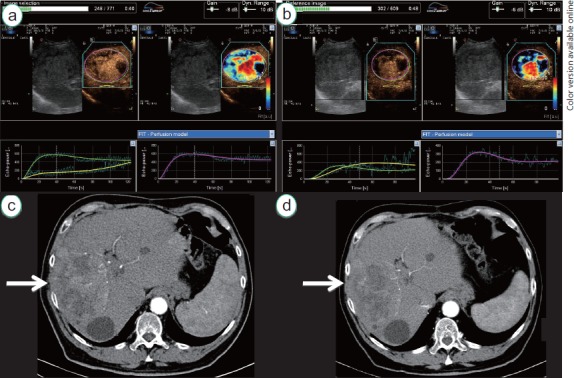
Fig. 3.

Quantification of enhancement under antiangiogenenic treatment. US contrast enhancement quantification, using a dedicated software before starting sorafenib treatment (a) and at two weeks post-treatment (b) indicates a reduction in the arterial enhancement and tumor perfusion (see curves under the ultrasound images). CT examination performed at baseline (c) the arrow indicates the active HCC and is the target of systemic treatment) and after two months of treatment (d) demonstrates stable disease according to dimensional criteria, with some increase of the nonperfused hypodense areas.
