FIGURE 3.

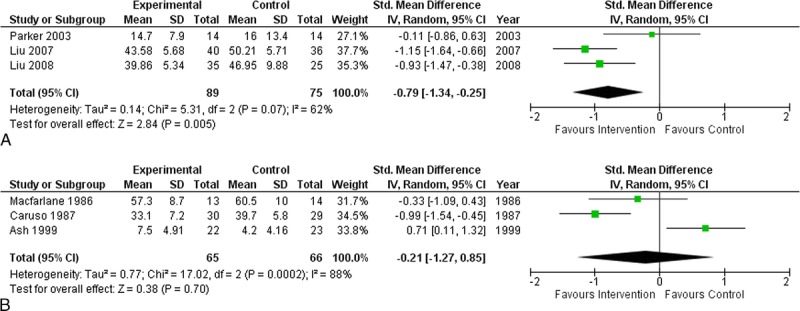
A, Forest plot of pharmacological treatments with active comparators for symptoms of depression. B, Forest plot of pharmacological treatments with inactive comparators for symptoms of depression.

A, Forest plot of pharmacological treatments with active comparators for symptoms of depression. B, Forest plot of pharmacological treatments with inactive comparators for symptoms of depression.