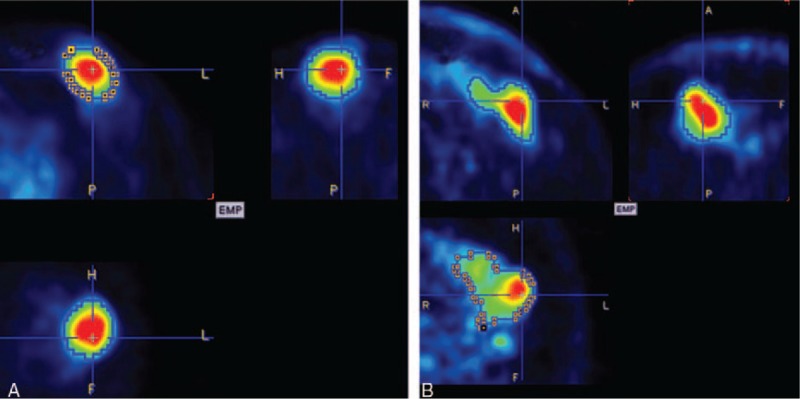
Figure 1.

Representative orthogonal slices. The difference of the metabolic tumor volume (MTV) between A (10.9 mL) and B (20.1 mL) is twice. Whereas B (71%) has almost 9-fold asphericity (ASP) values compared with A (8%). The tumor delineation is marked with a blue line.
