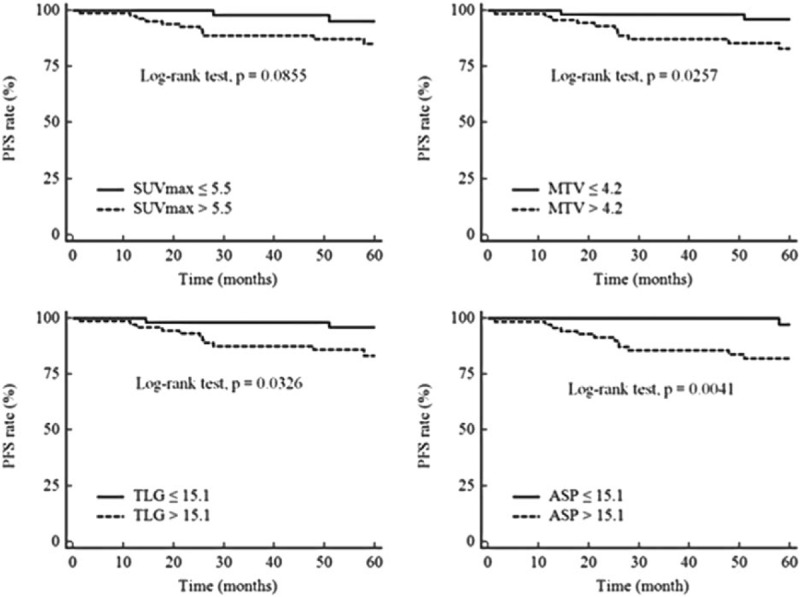
Figure 2.

Kaplan–Meier curves with respect to progression-free survival for all patients. Kaplan–Meier curves for the quantitative PET parameters, maximum standardized uptake value (SUVmax), metabolic tumor volume (MTV), total lesion glycolysis (TLG), and asphericity (ASP) with respect to progression-free survival (PFS) for all patients (n = 131). Cut-off values and P values are shown on each panel.
