Figure 2.

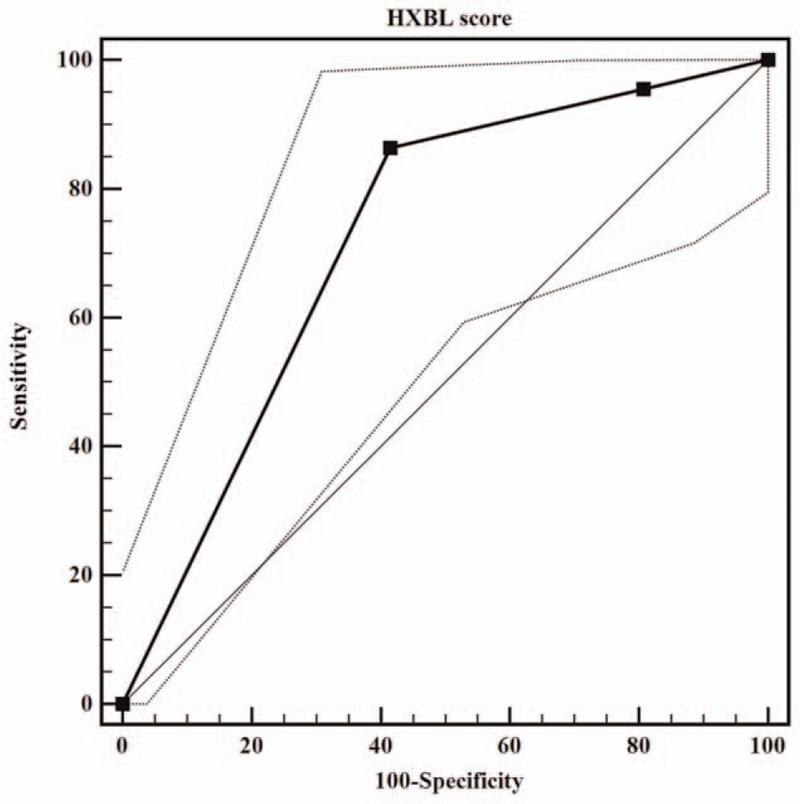
ROC curve analysis of the HXBL score. The resulting area under the ROC of the scoring model was 0.724 (95% CI, 0.646–0.793).

ROC curve analysis of the HXBL score. The resulting area under the ROC of the scoring model was 0.724 (95% CI, 0.646–0.793).