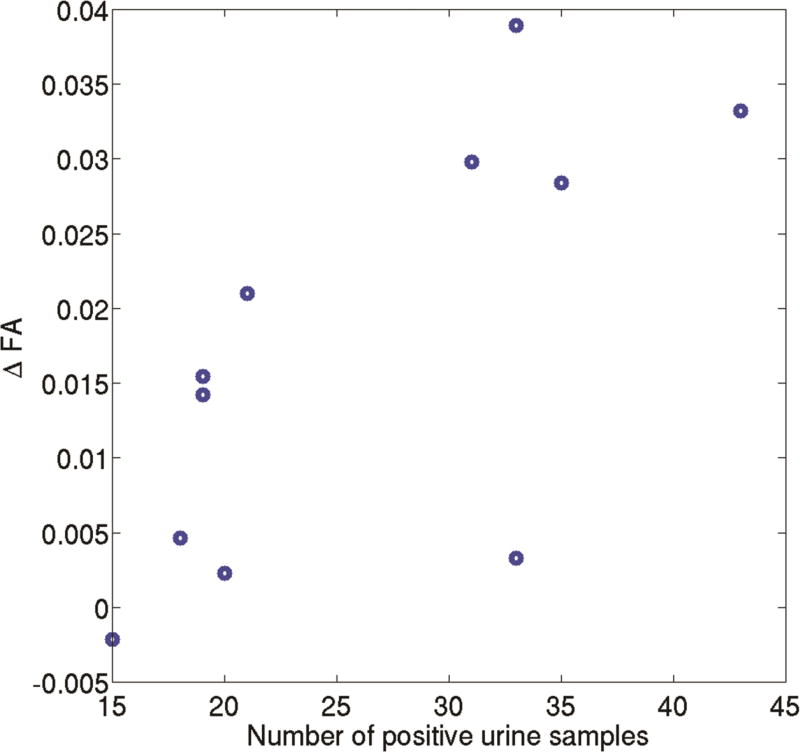
Figure 3.
Scatter plot between ΔFA, which is defined as FA (Scan 1) – FA (Scan 2), and the number of positive cocaine urine samples in CocUD subjects. The regression analysis (F =10.22, R2=0.87, and p = 0.008) found a significant positive correlation between ΔFA and the number of positive cocaine urine samples (p = 0.001).

