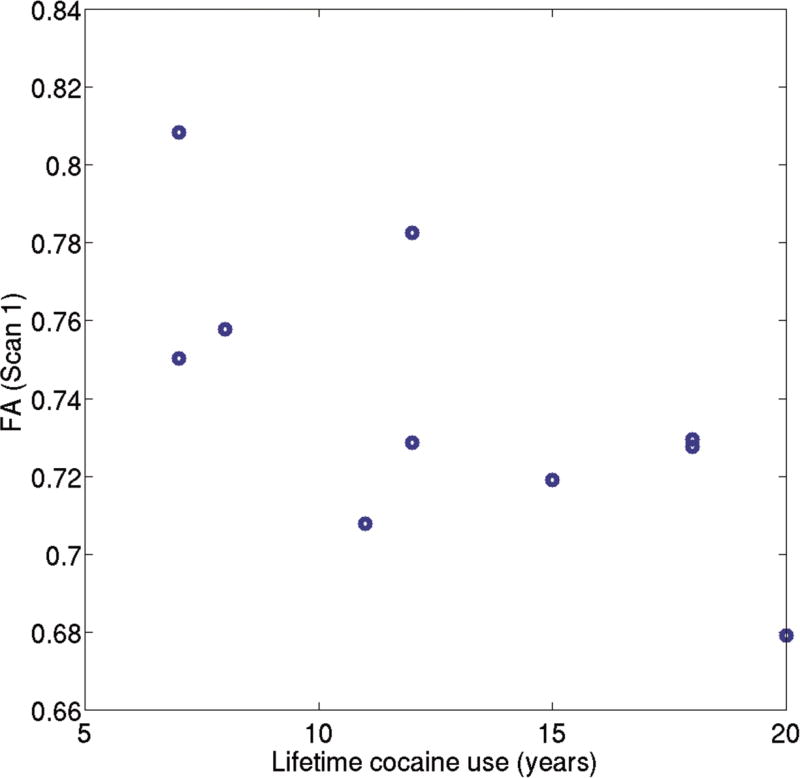
Figure 4.
Scatter plot between FA (Scan 1) and the lifetime cocaine use (years) in CocUD subjects. Both Pearson (rho = −0.6908, p = 0.0186) and Spearman (rho = 0.6636, p = 0.0260) correlation analyses found a significant and negative correlation between the baseline FA (Scan 1) and the lifetime cocaine use (years).

