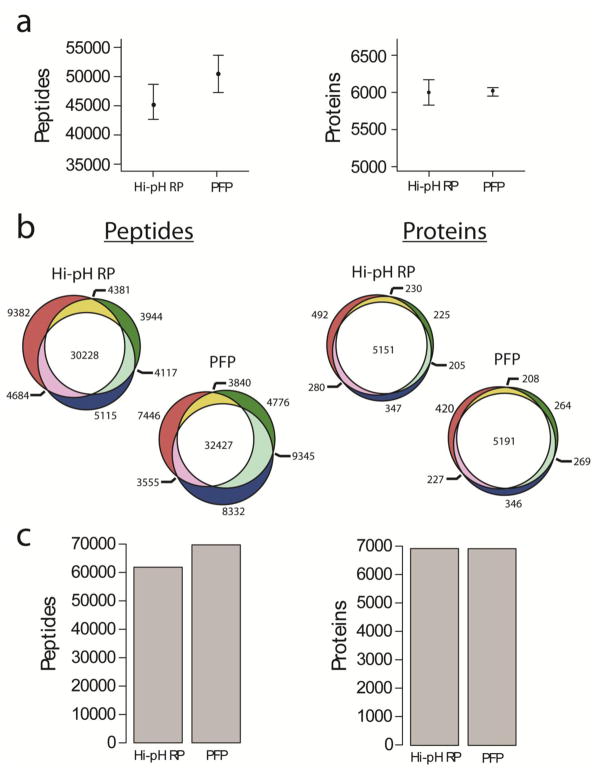
Fig. 3.
Comparison of method performance and reproducibility (A) Box and whisker plots of maximum, minimum and median peptide and protein identifications in triplicate experiments. Wilcoxon rank-sum tests were performed and differences in peptide (p = 0.2) and protein (p = 1) identifications between methods were not considered statistically significant. (B) Proportional Venn diagrams illustrating the reproducibility of peptide and protein identifications from each of the three replicate experiments for both Hi-pH RP and PFP. (C) Total peptide and protein identifications from the union of all three replicate experiments.

