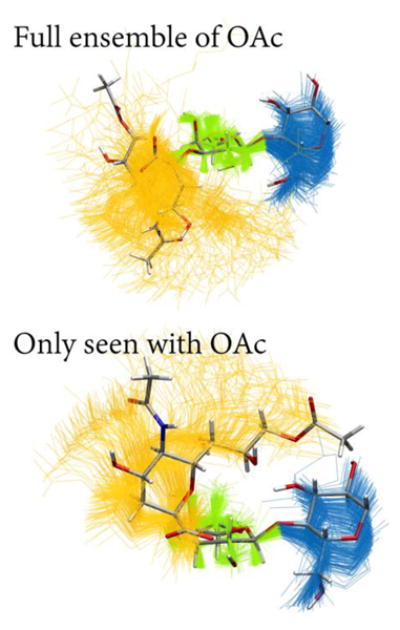
Figure 10.

Superimposed conformations of the 9OAc sialoside simulations, showing only carbohydrate residues and aligned using galactose heavy atoms. One representative conformation is shown in licorice representation (C, gray; O, red; N, blue; H, white. Top: The full conformational ensemble of Neu5,9Ac2α3Galβ4GlcβProN3 with snapshots taken 10 ns apart (Neu5,9Ac2, yellow; Gal, green; Glc, blue). Bottom: The conformations corresponding to the dotted box in Figure 8 with snapshots taken 10 ps apart. These rarely seen conformations were only visited in the O-acetylated simulations but are only a small part of the ensemble, being higher in free energy.
