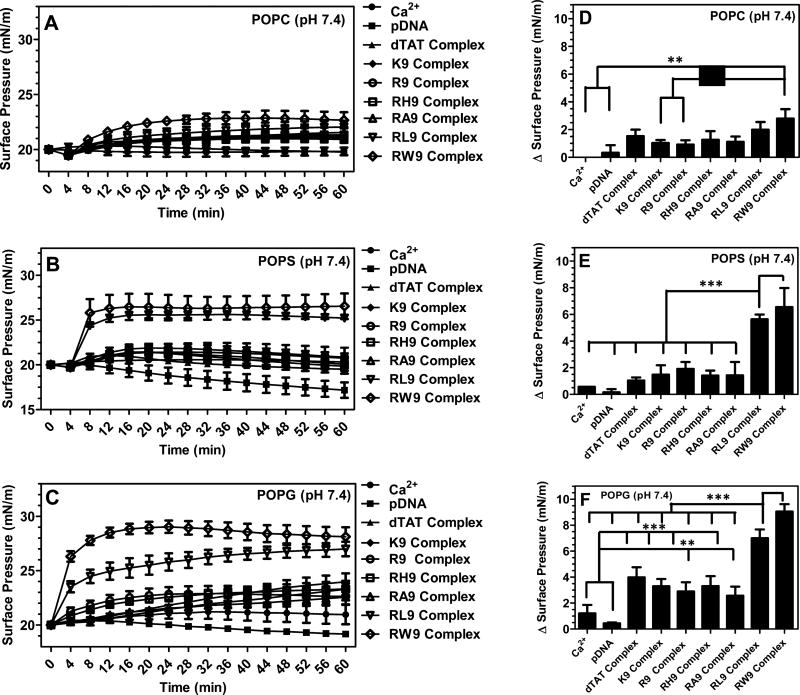
Figure 3.
Changes in surface pressure as a function of time following injection of the seven CPPs (dTAT, K9, R9, RH9, RA9, RL9, and RW9)/pDNA/Ca2+ complexes below POPC (A), POPS (B), and POPG (C) monolayers held at an initial surface pressure of 20 mN/m and at pH 7.4. The maximum change in surface pressure (plateau values) of the seven complexes when inserted below (D) POPC, (E) POPS, and (F) POPG monolayers. Results are presented as mean SD (n = 3) (***p < 0.0001, **p < 0.001, and *p < 0.05, one-way ANOVA, Tukey post test).

