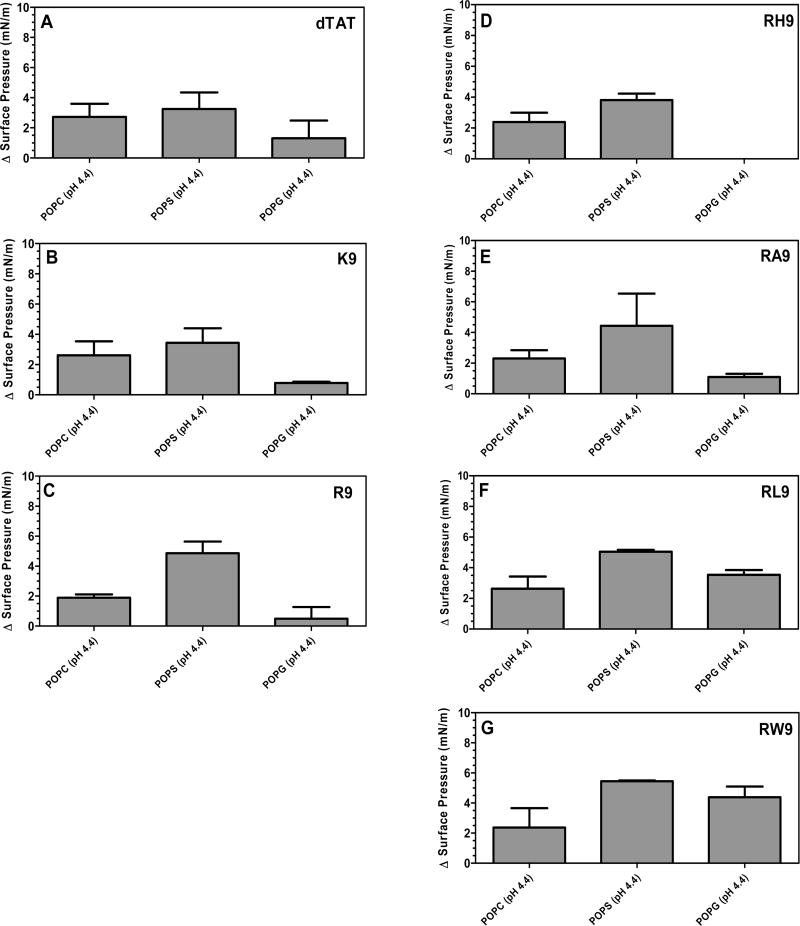
Figure 6.
Maximum change in surface pressure (plateau values) following injection of the seven CPPs (((A) dTAT, (B) K9, (C) R9, (D) RH9, (E) RA9, (F) RL9, and (G) RW9)/pDNA/Ca2+ complexes below POPC, POPS, and POPG PMs held at an initial SP of 20 mN/m and at pH 4.4. Results are presented as mean SD (n = 3) (***p < 0.0001 and **p < 0.001, one-way ANOVA, Tukey post test).

