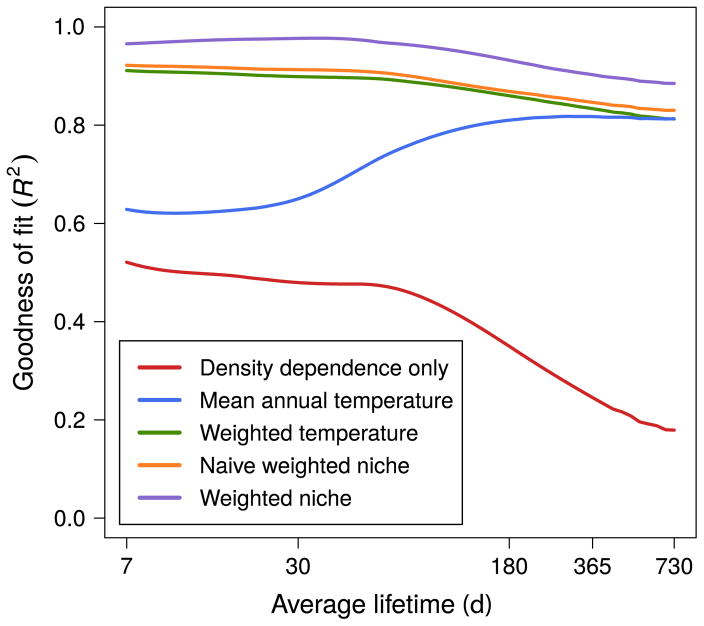
Fig. 3.
Average goodness of fit (R2) of 37 different ectotherm species using different environmental summary statistics. The mean environmental covariate uses the yearly mean of the daily environmental covariate, the weighted environmental covariate uses the weighted geometric sum of the daily environmental covariate. The naive weighted niche covariate uses the square of the annual weighted covariate while the weighted niche covariate uses the weighted geometric sum of the square of the daily environmental covariate. [Color figure can be viewed at wileyonlinelibrary.com]

