Figure 4.
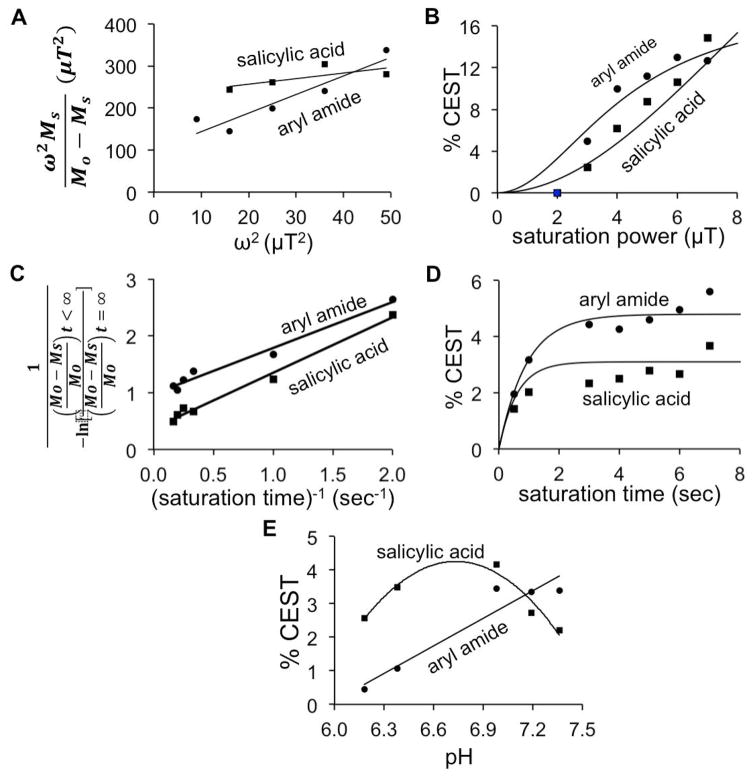
The effect of saturation power, time, and pH on CEST. (A) A linear HW-QUESP plot was used to analyze the relationship between saturation power and CEST signal amplitude for the aryl amide and salicylic acid protons, using a saturation time of 6 s. (B) This analysis was used to plot the non-linear relationship between saturation power and CEST signal. (C) A linear RL-QUEST plot was used to analyze the relationship between saturation time and CEST signal amplitude for the aryl amide and salicylic acid protons, using a saturation power of 4 μT. (D) This analysis was used to plot the non-linear relationship between saturation time and CEST signal. (E) The CEST signal amplitudes of the two exchangeable protons were dependent on pH. For these results with pH, lines are only included to aid the visualization of the experimental data, and these lines do not fit an experimental model. CEST spectra were acquired by applying selective saturation 85 selective frequencies spanning 15 to −15 ppm.

