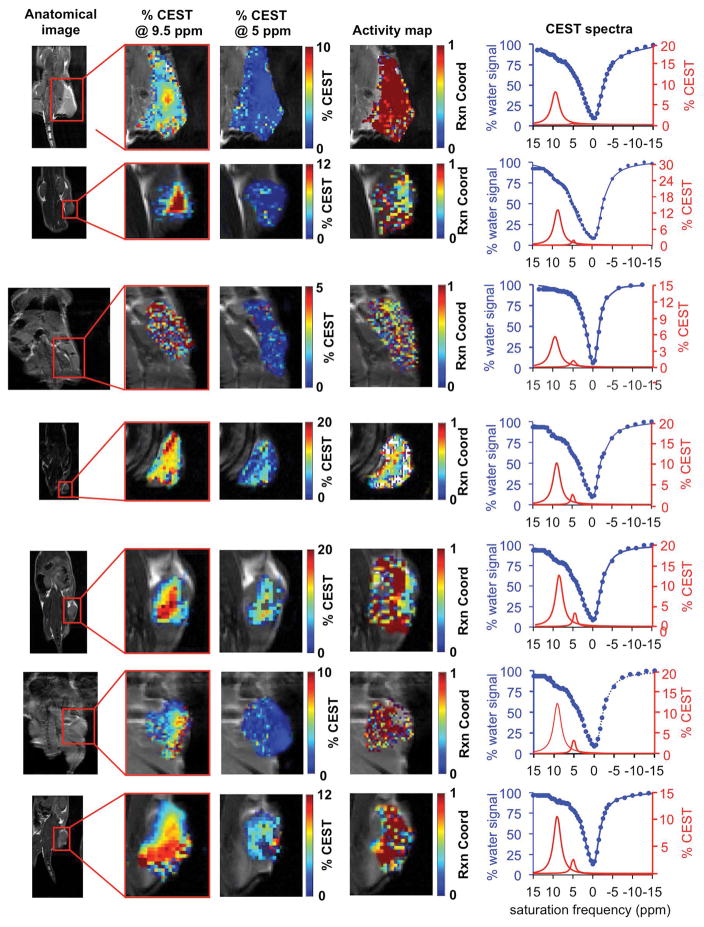
Figure 5.
In vivo catalyCEST MRI of uPA activity. A tumor model of Capan-2 pancreatic cancer showed high activity of urokinase Plasminogen activator (uPA). For each study, the xenograft flank tumor was identified with anatomical MRI, % CEST signal amplitudes at 9.5 ppm and 5 ppm were measured on a pixelwise basis, and an activity map of the uPA reaction coordinate were constructed using Eq. [2]. The CEST spectra of the tumor regions are also shown. CEST spectra were acquired by applying selective saturation at 4 μT for 6 s before acquiring a FISP MR image, at 85 selective frequencies spanning 15 to −15 ppm. Experimental CEST spectra are shown as blue circles, the fitting of the experimental spectra are shown as blue lines, and the CEST line shape spectra from these fittings are shown as red lines.

