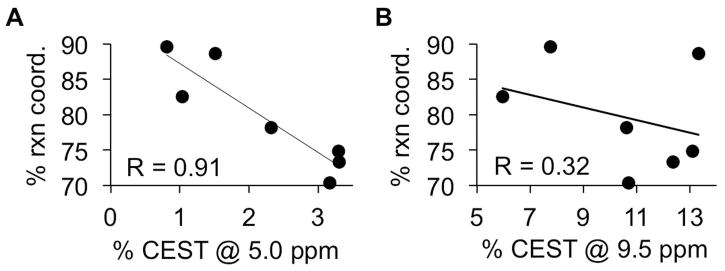
Figure 6.
The dependence of the reaction coordinate on CEST signal amplitudes. (A) The reaction coordinate showed a linear dependence on the CEST signal at 5.0 ppm, with an R correlation coefficient of 0.91. (B) The reaction coordinate was largely independent of the CEST signal at 9.5 ppm, with an R correlation coefficient of 0.32.

