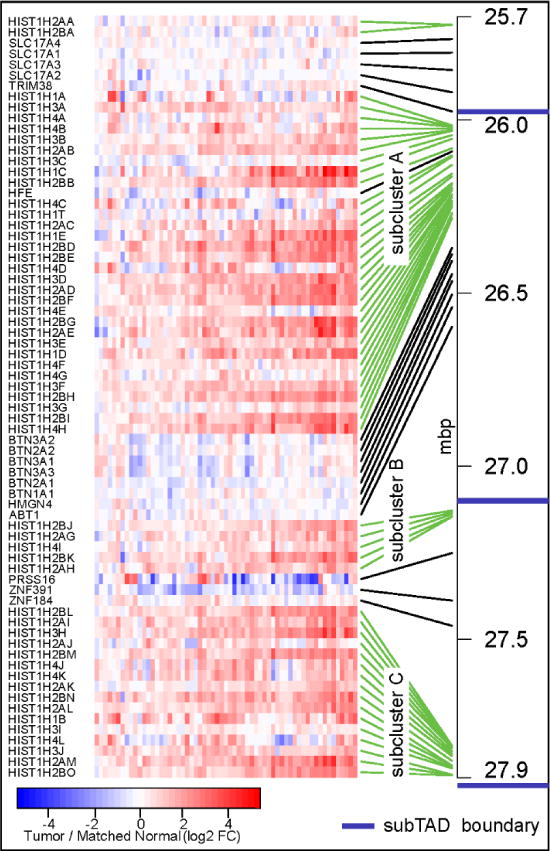
Figure 5. TCGA datasets for breast tumors confirms upregulation across the major histone locus in breast cancer patient samples.

Comparison of normal tissue adjacent to tumors demonstrates upregulation of the histone genes within the major histone gene locus in breast cancer tumors. The pattern is reminiscent of the MCF10 breast cancer progression series. The blue lines indicate the location of sub-TAD boundaries in the MCF10 series.
