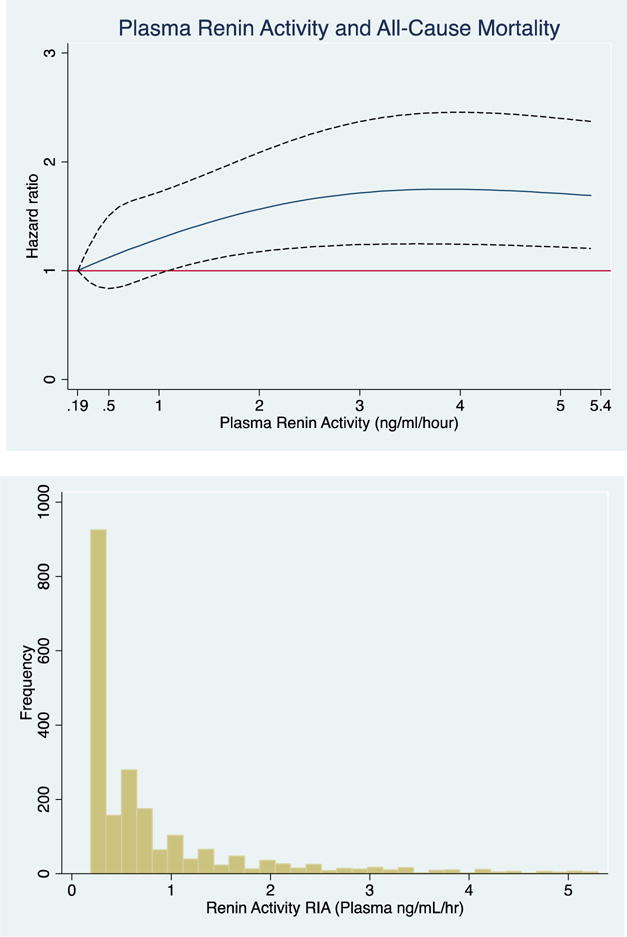
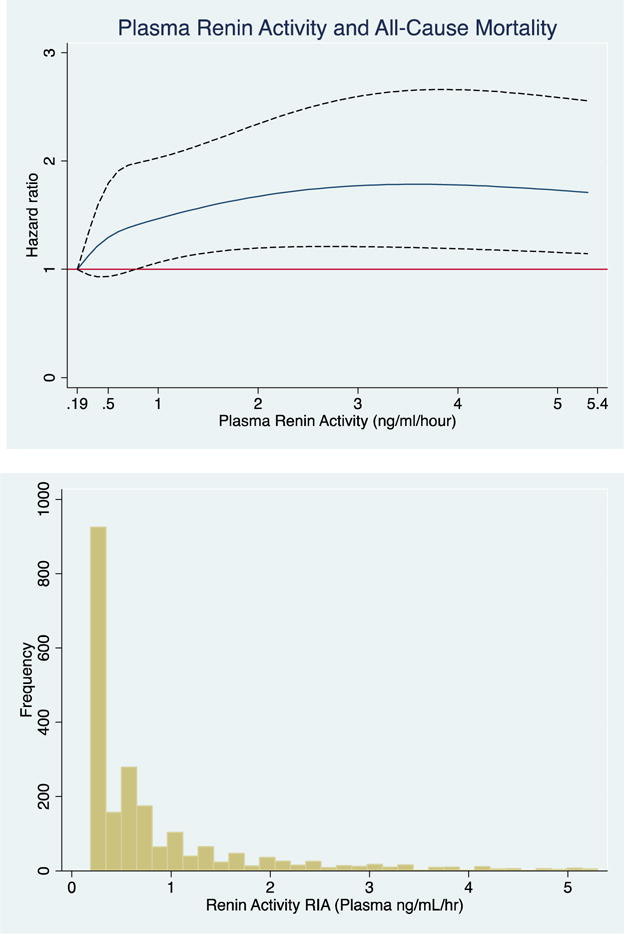
Figure 2. Associations of Plasma Renin Activity, Examined as a Continuous Variable, with All-Cause Mortality.


The cubic spline regression with 4 knots (referent) estimates the hazard ratio of plasma renin activity (ng/ml/hour) up to 95th percentile with all-cause mortality. Dotted lines represent 95% confidence intervals. Below each spline is the histogram of the distribution of plasma renin activity. A) unadjusted B) fully adjusted (age, sex, education, current occupation status, smoking, physical activity, dietary intake, alcohol use and body mass index, systolic blood pressure, low-density lipoprotein, HbA1c and eGFR.
