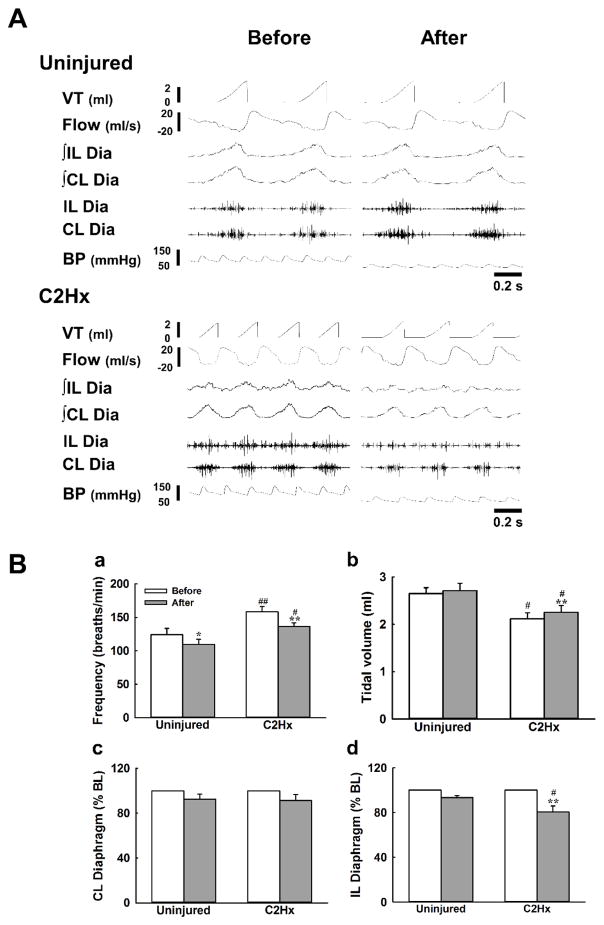
Fig. 1. The effects of ketanserin on the respiratory pattern and bilateral diaphragm EMG activity.
Panel A presents the representative examples of the cardiorespiratory pattern and bilateral diaphragm EMG activity in response to intravenous administration of ketanserin. Panel B shows the averaged response of respiratory frequency (a), tidal volume (b) and bilateral diaphragm EMG activity (c and d) before (white bar) and after (grey bar) ketanserin injection. VT: tidal volume. ∫: the rectified and smoothed EMG signals. CL: contralateral; IL: ipsilateral. Dia: the raw signals of the diaphragm EMG. *: P < 0.05; **: P < 0.01 significant difference between the value before and after ketanserin administration. #: P < 0.01; ##: P < 0.01 significant difference between uninjured and C2Hx animals.

