
Fig. 4. BET inhibition sensitizes HR-proficient tumors to PARPi treatment in vivo.
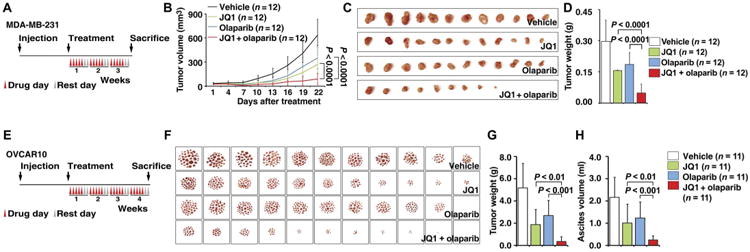
(A) Schematic illustrating the MDA-MB-231 mouse xenograft experimental design. MDA-MB-231 cells were implanted in the mammary fat pad and grown until tumors reached a size of about 30 mm3. Xenografted mice were randomized and then received vehicle, JQ1 (50 mg/kg), olaparib (50 mg/kg), or the combination of both agents as indicated (5 days a week for 3 weeks). Caliper measurements were taken every 3 days after the initiation of drug treatment. (B) Mean tumor volume is shown. Statistical analysis by Student's t test. Error bars represent means ± SD. (C) Images of tumors collected from animals receiving vehicle, JQ1, olaparib, or the combination of both agents. (D) Individual tumor weights from different treatment groups are shown. Statistical analysis by Student's t test. Error bars represent means ± SD. (E) Schematic illustrating the OVCAR10 mouse xenograft experimental design. OVCAR10 cells were implanted intraperitoneally in mice and grown for 2 weeks. Xenografted mice were randomized and then received vehicle, JQ1 (50 mg/kg), olaparib (50 mg/kg), or the combination of both agents as indicated (5 days a week for 4 weeks). (F) Images of the tumor nodes (diameter, >0.5 mm) collected from mice receiving different treatments. (G and H) Quantification of the weight of tumor nodules (G) and the volume of ascites (H) in mice receiving different treatments. Statistical analysis by Student's t test. Error bars represent means ± SD.