
Fig. 7. JQ1 represses the enhancer-promoter interaction of BRCA1.
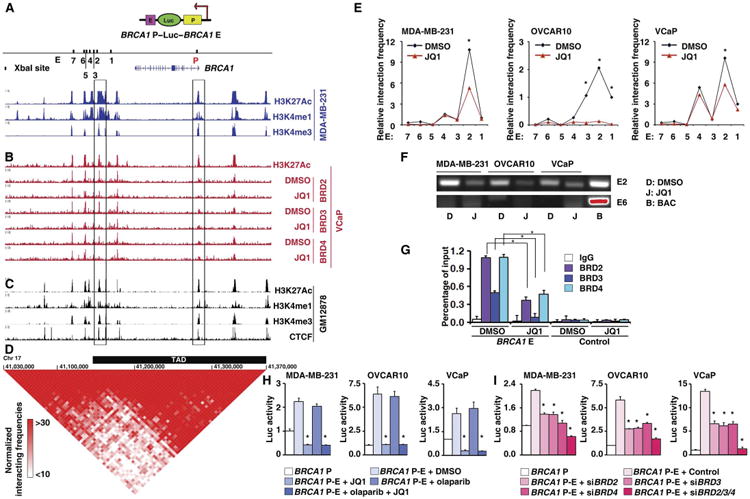
(A) H3K27Ac, H3K4me1, H3K4me3 profiles in MDA-MB-231. Right and left rectangle frame areas indicate the BRCA1 promoter and enhancer locus 2, respectively, which were used for the BRCA1 promoter-enhancer reporter construct. Upper schematic illustration indicates the construction of the BRCA1 promoter-enhancer reporter. Lower schematic illustrates the Xba I restriction sites in BRCA1 promoter and enhancer loci. P in red indicates promoter, and E in black indicates enhancer. Numbers 1 to 7 indicate seven Xba I restriction sites in the enhancer locus. The position of the BRCA1 gene is indicated below. (B) H3K27Ac in VCaP cells (top) and BRD2/3/4 profiles in VCaP treated with DMSO or JQ1 (bottom). (C) H3K27Ac, H3K4me1, H3K4me3, and CCCTC-binding factor (CTCF) profiles in GM12878. (D) A BRCA1 topologically associated domain (TAD) region (indicated by a thick black bar) was predicted on the basis of the Hi-C data. Normalized Hi-C interacting frequencies were shown as a triangle-like two-dimensional heat map, which was overlaid on ChIP-seq data (C) in GM12878 cells. Red indicates the intensity of the interacting frequencies of the Hi-C data. Chr 17, chromosome 17. (E) 3C-qPCR analysis of long-distance interactions between the BRCA1 promoter and seven enhancer loci [locus 1 to 7 indicated in (A)]. The relative amount of ligation product between the BRCA1 promoter and each of the seven different enhancer loci was plotted. Results from MDA-MB-231, OVCAR10, and VCaP cells treated with DMSO or JQ1 are shown. The data were normalized to a GAPDH loading control. (F) PCR products from the BRCA1 promoter and enhancer locus 2 (E2, top) and from the BRCA1 promoter and enhancer locus 6 (E6, bottom). Ligation sample from bacterial artificial chromosome (BAC) was used as a positive control. No specific PCR product was found in the ligation sample from the BRCA1 promoter and enhancer locus 6, even when the BAC control band was overexposed (shown in red). (G) Quantification of the amount of BRCA1 enhancer locus 2 bound to BRD2/3/4 in MDA-MB-231 cells treated with DMSO or JQ1. (H) Luciferase reporter assay of BRCA1 enhancer activity in MDA-MB-231, OVCAR10, and VCaP cells treated with DMSO, JQ1, olaparib, or JQ1 combined with olaparib. (I) Luciferase reporter assay of BRCA1 enhancer activity in MDA-MB-231, OVCAR10, and VCaP cells treated with BRD2/3/4 siRNA.