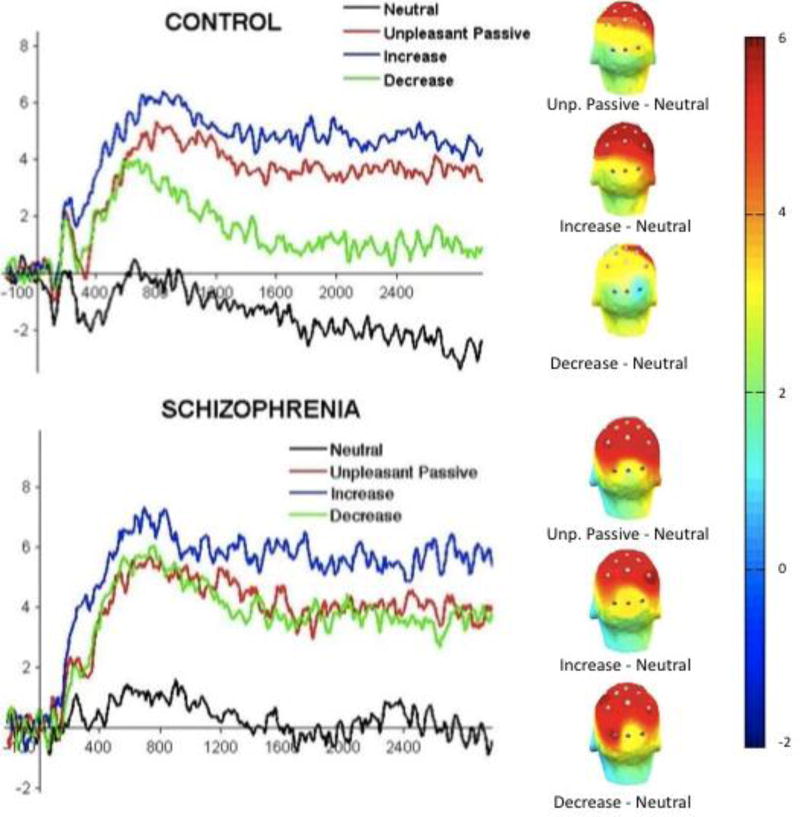
Figure 3. LPP Grand Average Waveforms by Group and Emotion Regulation Condition.
Note: Waveforms illustrate that CN were adept at decreasing and increasing negative emotion via reappraisal; SZ were adept at increasing, but not decreasing negative emotion via reappraisal. Scalp maps demonstrate that SZ and CN displayed the LPP at the expected centroparietal midline electrodes. LPP = Late Positive Potential; The LPP is evaluated at 300 – 3000 ms post-stimulus onset. Grand average waveforms depict time-series data for the means displayed in Figure 2.

