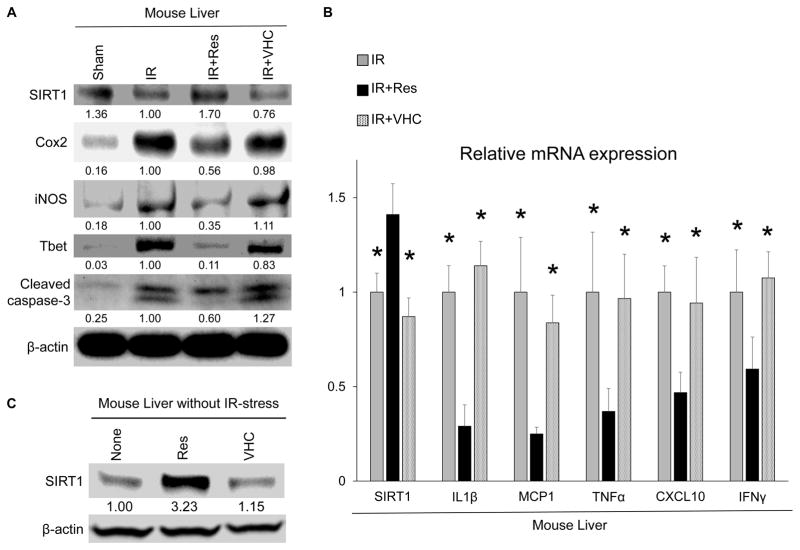
FIG. 3.
Res up-regulates SIRT1 and suppresses inflammatory cytokine production in IR-stressed liver. (A) Protein levels of SIRT1, COX-2, iNOS, Tbet, and cleaved caspase 3 were evaluated by Western blotting. The intensity of the bands was quantified with ImageJ and normalized by dividing the target band intensity by that of housekeeping β-actin. The values under the bands represent the relative ratio of normalized intensity as compared with that of IR. Representations of 3 experiments are shown. (B) Quantitative RT-PCR–assisted detection of mRNA coding for SIRT1, IL1β, MCP1, TNF-α, CXCL10, and IFNγ. Expression levels were normalized to HPRT expression, then normalized to expression of IR group (*P < 0.05 versus IR+Res; n = 4; 1-way ANOVA). Data are presented as mean ± SD. (C) Liver samples without IR stress were harvested from wild-type naïve mice 8 hours after treatment with Res (25 mg/kg IP) or VHC. The values under the bands represent the relative ratio of normalized intensity compared with that of untreated mice. Representations of 3 experiments are shown.

