
Figure 6.
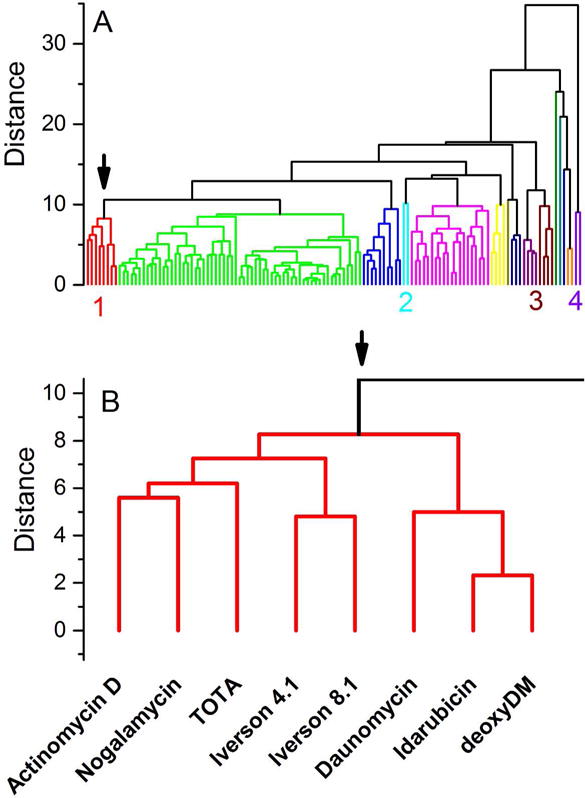
Dendrogram for the hierarchical clustering of the binding landscape shown in figure 2 with respect to the observations, the 126 compounds studied. (A) Dendrogram derived for the complete set of compounds. Clusters are identified by separate colors. The labels 1, 2, 3 and 4 identify clusters discussed in the text. (B) Enlargement of cluster 1 colored red in panel (A), now including the compound names for each arm of the dendrogram.