
Fig. 1. Arterial isolation leads to a decrease in total and surface Kv1.5.
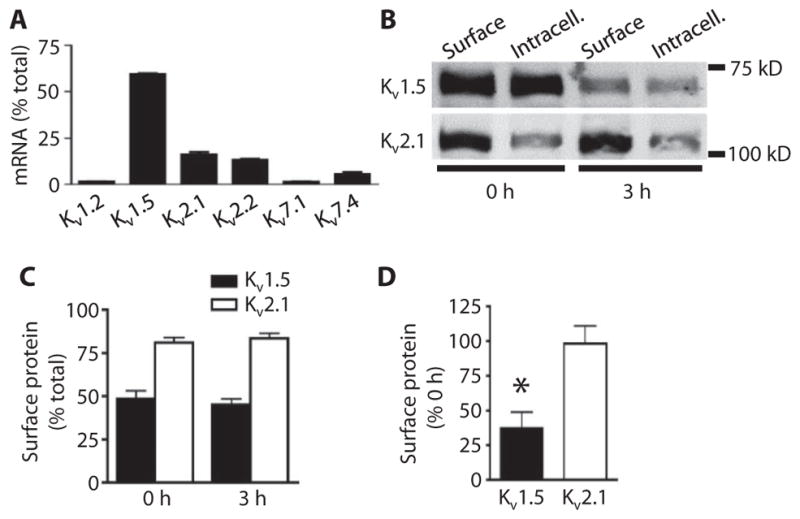
(A) Quantitative real-time PCR mean data for transcripts of six Kv family members in pure arterial myocytes. n = 3 for each. Data are expressed as the percent of total Kv transcripts. (B) Representative Western blot images of arterial biotinylation samples showing the nonbiotinylated [intracellular (Intracell.)] and biotinylated (Surface) abundance of Kv1.5 and Kv2.1 in mesenteric arteries immediately after (0 hour) and 3 hours after arterial isolation. (C) Mean data showing the percent of total Kv1.5 and Kv2.1 at the cell surface for arteries immediately and 3 hours after isolation. n = 6 for each. (D) Mean data showing percent of Kv1.5 and Kv2.1 remaining at the cell surface after 3 hours relative to the 0-hour samples. n = 6 for each. *P < 0.05 versus 0 hour.