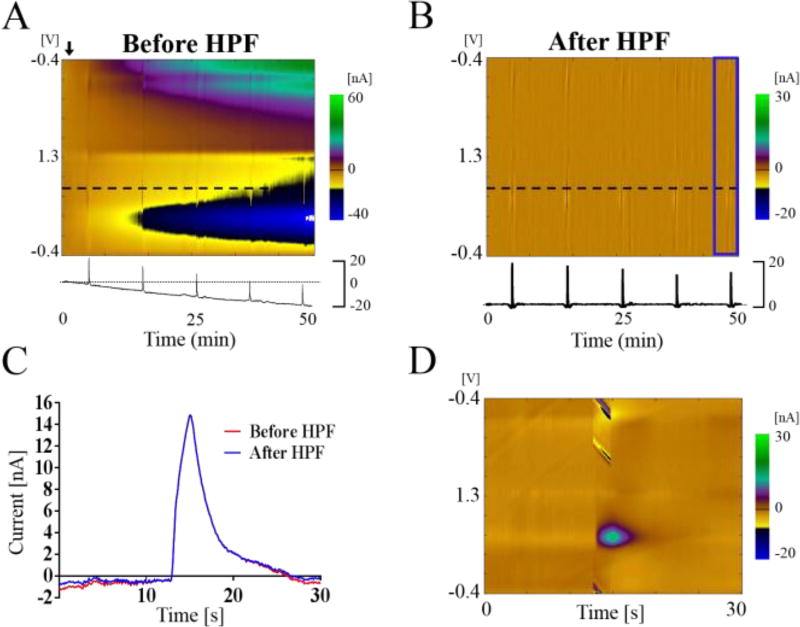
Figure 4.
Result of applying detrending technique to in vivo experiment. Electrical stimulation-evoked dopamine release in the nucleus accumbens of a rat. Stimulation was applied to the medial forebrain bundle. Data is from 50+ minutes of recordings. Stimulations once every 10 minutes. (A) The negative background drift obscures the stimulation data. Black dotted horizontal line at +0.6 V indicates the time series plotted below. (B) Color plot after applying the high pass filter (HFP). Blue area is magnified in (D). (C) The time series plot of the evoked dopamine response shows that dopamine kinetics at the CFM are not affected by the applied filter (After HPF, blue line). (D) The 5th electrical stimulation response is magnified from (B), with the peak evoked dopamine response (green) occurring at +0.6 V.

