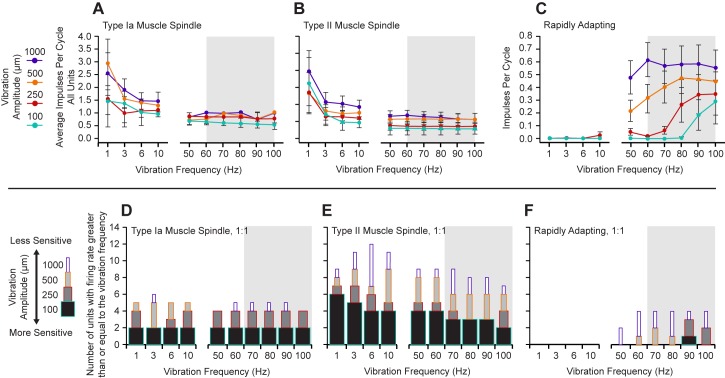
Fig 2. Sinusoidal displacement frequency response profiles for the three identified response groups.
The grey background denotes the band of frequencies known to trigger the kinesthetic illusion [15, 40–42]. The average impulses per cycle for all of the peripheral units. (A) Type Ia muscle spindles displayed high average impulses per cycle across the lower frequencies. (B) Type II muscle spindle fibers were similar to type Ia’s in the lower frequencies as well. (C) The average impulses per cycle for the RA response group were higher for the measured frequencies within the active range of the kinesthetic illusion. In contrast, the type Ia and type II slowly adapting populations showed the most activity in frequencies outside of the active range for the kinesthetic illusion. 1:1 thresholds were defined as responses tracking with 98–102 spikes over 100 cycles. Vibration amplitude boxes are stacked. (D) Type Ia muscle spindles show a flat, yet highly sensitive (at least 1:1 at 100 μm displacements) response across all measured frequencies. (E) Type II muscle spindle fibers were also sensitive across the measured frequency range although more sensitive to lower frequencies. (F) The RA-MS-type population was specifically sensitive to the higher measured frequencies with the highest sensitivity observed at 90 Hz. The RA-MS population was mostly insensitive to the lower frequencies at all but the highest (1 mm) displacement. The most sensitive portion of the frequency response profile for the RA-MS-type group response aligns with the reported frequencies of the kinesthetic illusion [15, 40–42].

