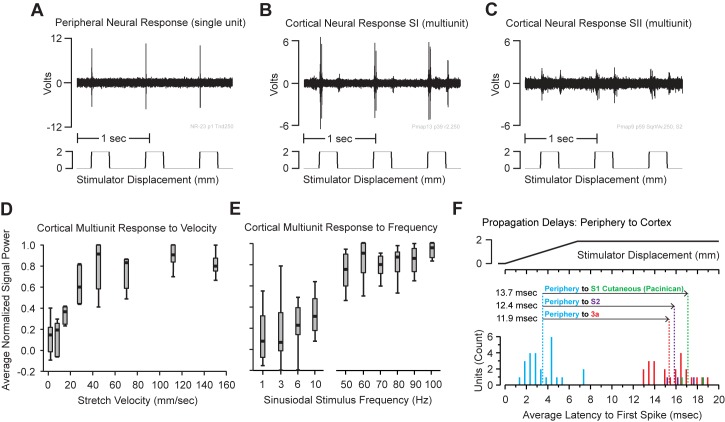
Fig 6. Peripheral and cortical response properties of the units searched out with tapping input.
(A) A peripheral neural recording trace of an RA-MS-type single unit showing the characteristic responsiveness to the rapid onset of a square wave displacement and insensitivity to the static phase. (B) A cortical transitional zone multiunit (spike) recording of the input from a single forelimb muscle showing strong registration with the peripheral nerve activity. (C) A cortical S2 multiunit (spike) recording from an electrode penetration representing the entire forelimb showing similar response properties to both the peripheral and cortical transitional zone responses. (D) Calculation of cortical signal power shows an onset velocity of at least 30 mm/s was required for activation which was similar to the peripheral nerve RA onset rate dependent responses. (E) More cortical multiunit activity (increased signal power) was observed at the higher frequency band (50–100 Hz) with the highest measured activity recorded at 100 Hz (See also: Fig 2C and 2F). (F) Propagation delays from the periphery to cortex. Histograms for average time to first spike following a square wave input for 25 single units in the periphery (Blue), 23 single units in the transitional zone (Red), 3 single units in S2 (Purple), and 2 single units isolated with respect to a Pacinian corpuscle response in the cutaneous representation of S1 (Green). Average latencies for each population form the onset of the square wave were: 3.5 ms +/- 1.6 for the periphery, 15.4 ms +/- 1.7 for the transitional zone, 15.8 ms +/- 1.3 for S2, and 17.1 ms +/- 1.5 for the Pacinian response in the cutaneous representation of S1. The propagation delays from periphery to cortex were calculated by subtracting the average peripheral latency from the average cortical latencies for each cortical area.

