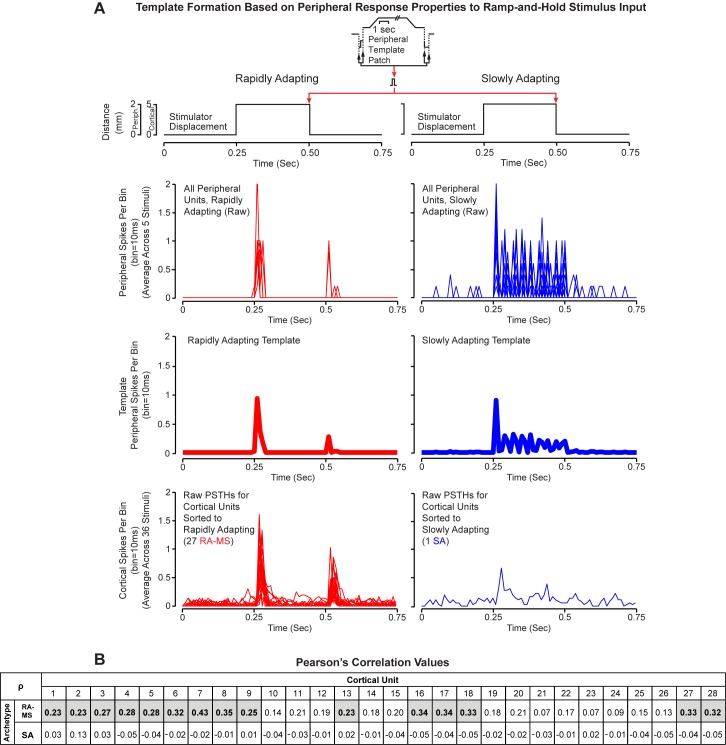
Fig 8. Response data from cortical units with application of square wave stimuli and from peripheral recordings patched from the square wave portions of the ramp-and-hold stimuli.
(A) Stimulator displacement (top), raw PSTH values for peripheral recordings from RA-MS-Type (red middle top) and SA units (blue middle top), template PSTH values for the RA-MS-Type (red middle bottom) and SA (blue middle bottom) peripheral response groups, and raw PSTH values for individual cortical units sorted to RA-MS (red bottom) and SA (blue bottom). All but one cortical recording for square wave inputs were classified to the RA-MS-type response group. (B) Matrix of Pearson’s correlation coefficients (ρ) calculated between each of the 28 individual cortical unit transformed histograms (columns) and the two response group templates (rows). Values shaded with bold text indicate a significant correlation (p<0.05).

