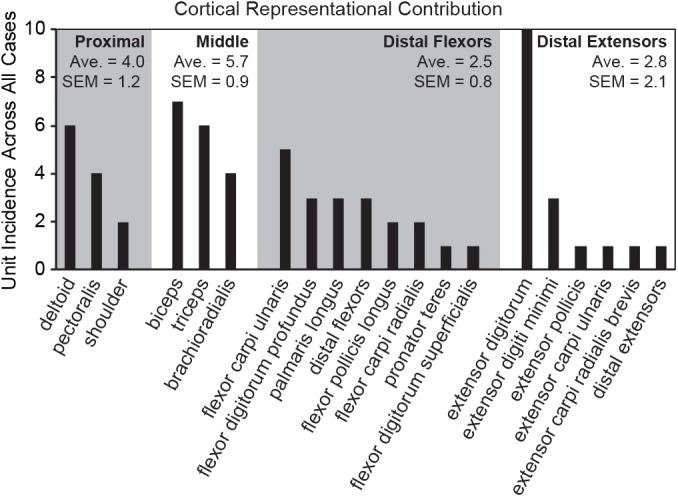
Fig 9. A count of the incidence of each muscle receptive field recorded in the cortex across all seven brain mapping cases.

The highest number of RA-MS group responses projected to muscles crossing the proximal joints and the extensor digitorum, with fewer responses projecting to the distal phalangeal flexors and extensors.
