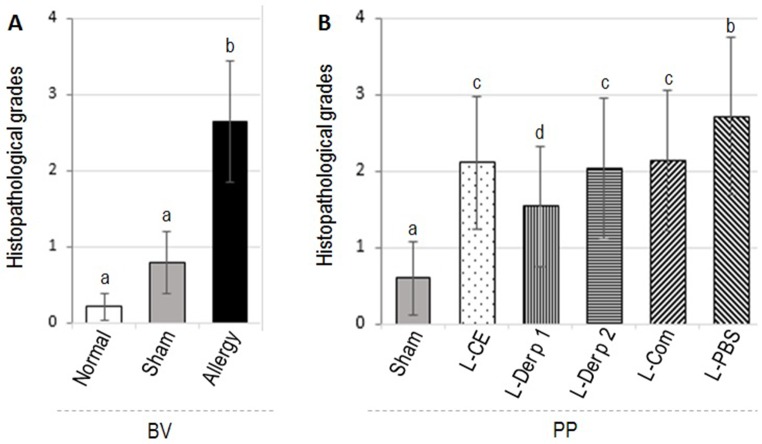
Fig 3. Histopathological grades (mean ± SD) of lung tissues of (A) allergenized, sham and normal mice (BV) and (B) allergenized mice that received vaccines/placebo followed by provocation (PP).
Bars with different letters (a and b in A) and (a, b, c, and d in B) are statistically different at p ≤ 0.05.

