
Figure 1.
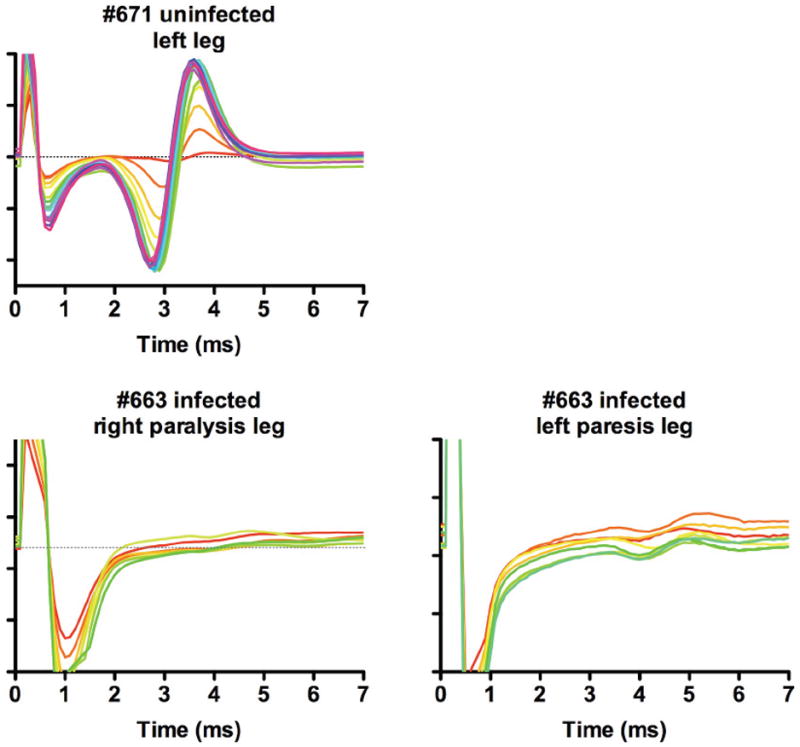
M-wave tracings from hind limbs of WNV-infected hamster with paresis or paralysis for calculation of MUNE (Siddharthan et al., 2009). Animal #671 was uninfected. Hamster (#663) was injected s.c. with WNV, which became paralyzed in the right limb and had paresis (limb weakness) on the left limb. MUNE in both limbs are graphically represented. The graphs are constructed such that the greater number of MUNE increments produces more of the color spectrum beginning with yellow, to orange, to red, and to blue.