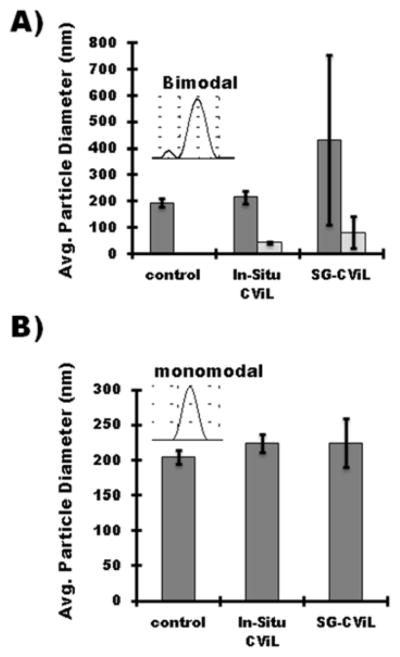
Figure 5.
Cation mediated interaction of SG-CViL generated silica with cationic liposomes Graphs represent particle size of (A) 10 mol% TAP-liposomes and (B) 20 mol% TAP-liposomes in buffer without TMOS exposure (control), present in buffer during TMOS deposition (in-Situ), or added to buffer post TMOS deposition (SG-CViL). Light grey bars in (A) correspond to small particle population peak in particle size distribution (see inset). TMOS deposition was performed for 10 min at 30C in 1X pH 7.4 PBS buffer. Error Bars represent the standard deviation of N=3 experiments

