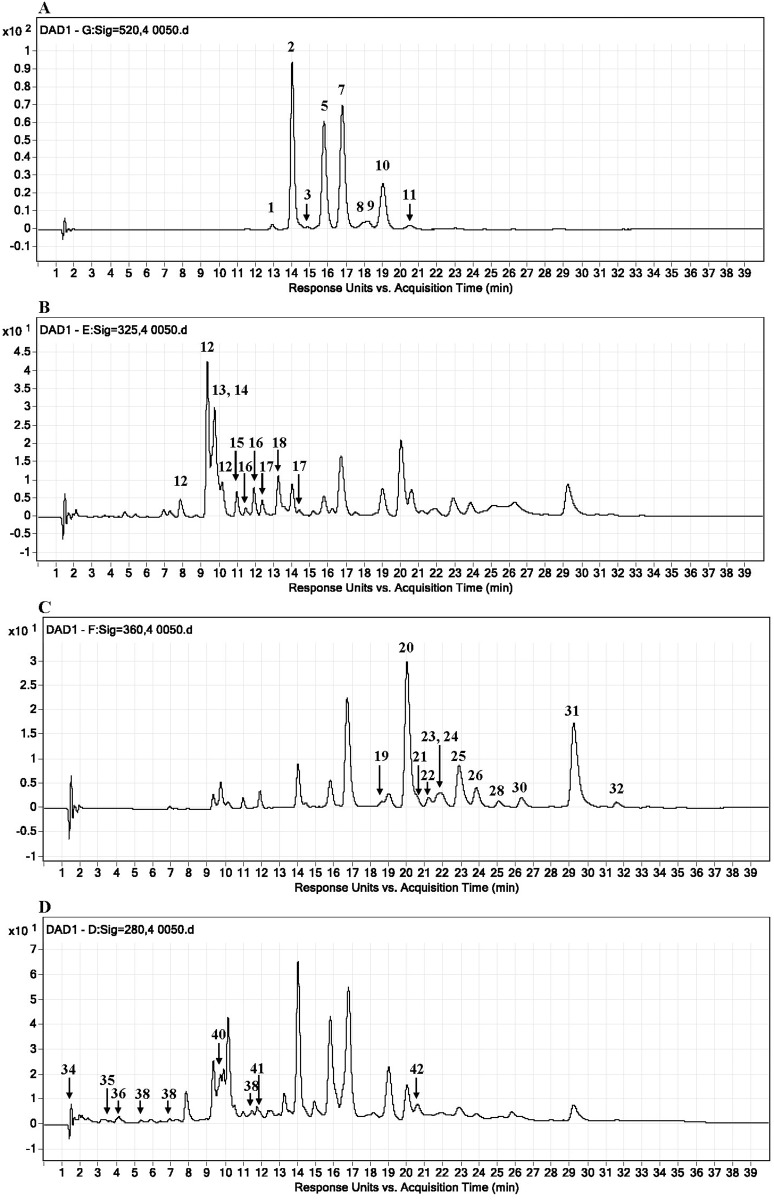
Fig 1. HPLC-DAD chromatograms of the berry fruit extract.
HPLC-DAD traces at 520 (A), 325 (B), 360 (C) and 280 (D) nm, respectively (chromatograms recorded after 80-fold dilution of the berry fruit extract). Peak numbers correspond to the compounds listed in Table 1.

