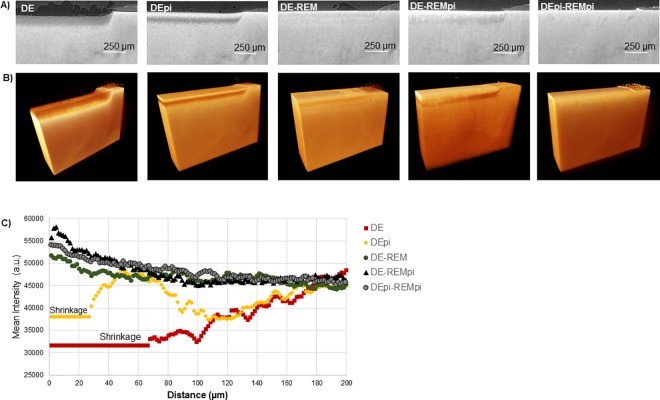
Fig 4.
(A) X-ray virtual slices illustrating x-ray attenuation data from MicroXCT tomograms of each sample. (B) Three-dimensional plots of attenuation intensities across the samples. (C) Mineral intensity profiles in arbitrary units (a.u.) across human dentin from most demineralized outer surface of the lesion and proceeding inwards through the depth of the lesion and into sound dentin before and after PILP treatments (open circles, squares, triangles, and diamonds).

