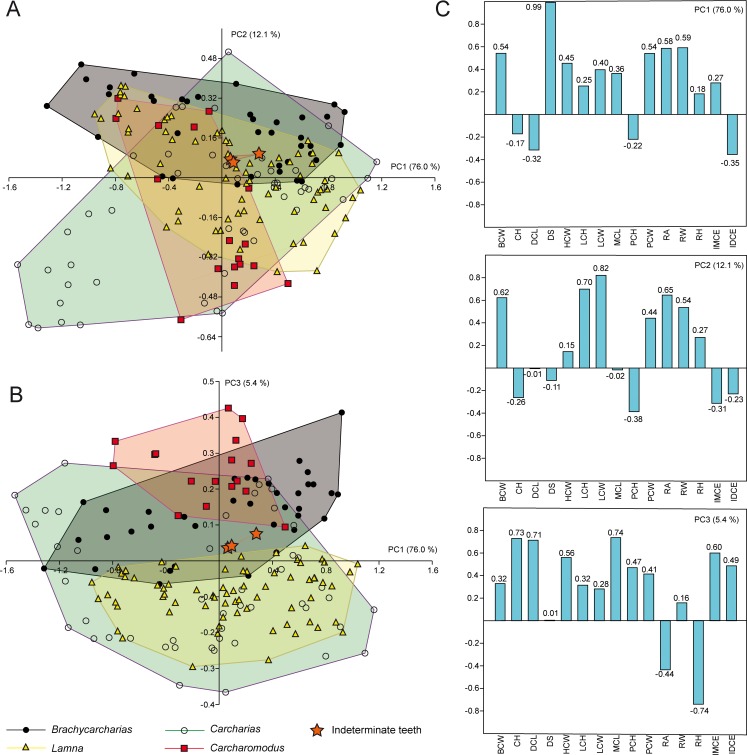
Fig 2. PCA.
Results of PCA performed on the entire sample of standardized and log-transformed measurements for Brachycarcharias, Lamna, Carcharias and Carcharomodus, represented as convex hulls; (A) Morphospace plotted on PC1 and PC2; (B) Morphospace plotted on PC1 and PC3; (C) Loading values showing the variables associated with the first three PC axes.

