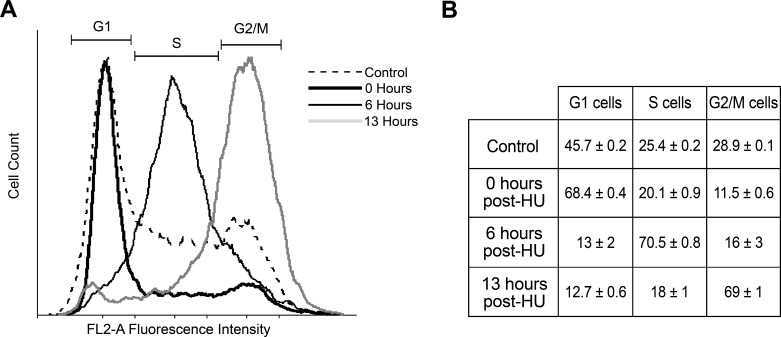
Fig 1. Cell cycle phase distribution of synchronized T. cruzi epimastigotes.
DNA content analyses using propidium iodide staining were performed for parasites populations at 0 h (bold line), 6 h (simple line), and 13 h (grey line) post-HU release, which correspond to G1, S, and G2 peaking times respectively. Representative experiments of each phase are presented (solid lines), and an asynchronous culture harvested prior to HU treatment is shown as a control (dotted line). The inset table shows the percentages of cells gated in G1, S or G2/M-phase for the three replicates, expressed as mean ± SEM.

