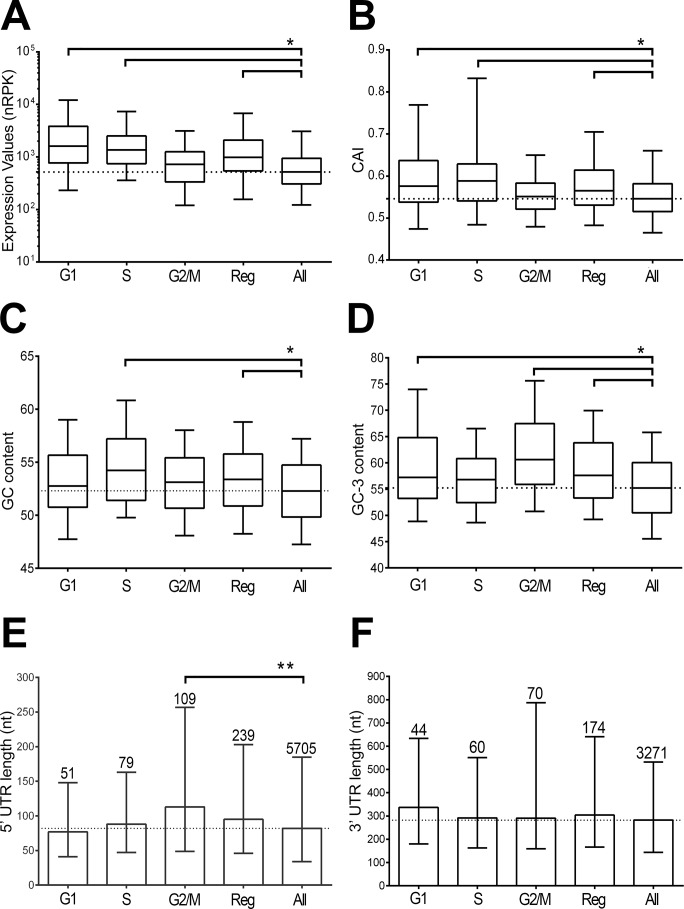
Fig 4. Analysis of structural characteristics of cell cycle regulated genes.
Six parameters were calculated for five gene groups: phase specific cell-cycle genes at G1 (70), S (97), G2/M (138), the 305 three phase combined gene dataset (Reg) and the total 7860 expressed genes (All). A. Gene expression levels of individual datasets. B. Codon adaptation index [54]. C, D. GC and GC3 content respectively. E, F. 5’ and 3’ UTR length respectively. The numbers above the bars indicate the number of UTRs that could be assigned to each group of genes. Box plots show the median and the 25–75 percentiles, whereas the whiskers represent the 5–95 percentiles. Bar graphs show the median and the interquartile range. Statistical significant differences were assessed by one-way ANOVA test and multiple comparisons were corrected by Bonferroni test (*, adjusted p-values lower than 0.01 by nonparametric Mann-Whitney test; **, exact p-value lower than 0.05).

