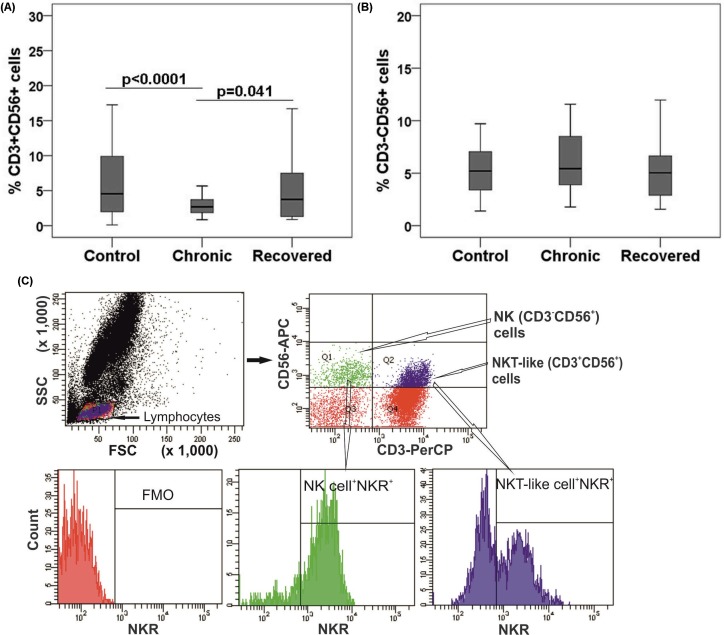
Fig 1. NK (CD3-CD56+) and NKT-like (CD3+CD56+) cells distribution during chikungunya.
Percentages of the lymphocytes mentioned were determined from the whole blood of 35 chronic patients, 30 individuals recovered from chikungunya, and 69 controls. Box plots show the percentages of (A) NKT-like cells and (B) NK cells. Boxes represent interquartile ranges, vertical lines represent ranges and horizontal lines represent medians. Nonparametric Kolmogorov-Smirnov-test was used for intergroup comparison. p value <0.05 is considered significant. (C) Gating strategies used for NK, NKT-like and NK receptors+ (NKRs+) NK/NKT-like cells were same as described earlier [30]. Lymphocytes are gated in FSC vs. SSC plot, upper left quadrant (Q1) of contour plot shows NK cells (CD3-CD56+) and upper right quadrant (Q2) shows NKT-like cells (CD56+CD3+). NK/NKT-like cells were gated within the lymphocytes as per CD56 and CD3 staining pattern and NKRs were gated on NK/NKT-like cells individually. The gate for NKR expression was set as per the expression in fluorescence minus one (FMO) cells.Histogram plots represent the percentage of NKRs+ (NK receptors) NK/NKT-like cells.

