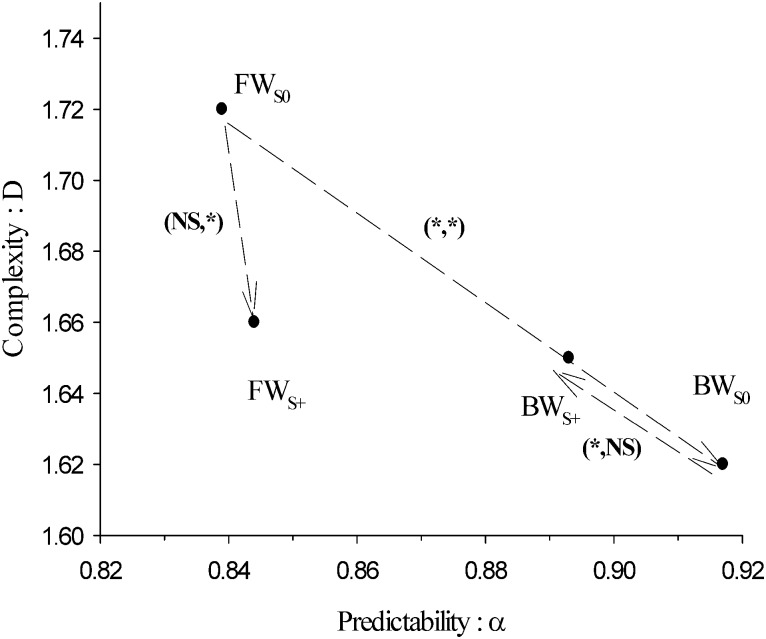
Fig 7. Evolution of the fractal dimension (D) versus the Hurst exponent (α) taken as complexity and predictability indices respectively for the four experimental conditions.
Standard deviations have not been plotted for the sake of clarity. To guide the eyes, arrows indicate the four post-hoc comparisons performed with their significance or not. The notation (NS/*, NS/*) denotes statistically significant differences (*) or no (NS) in the (α, D)–plane.

