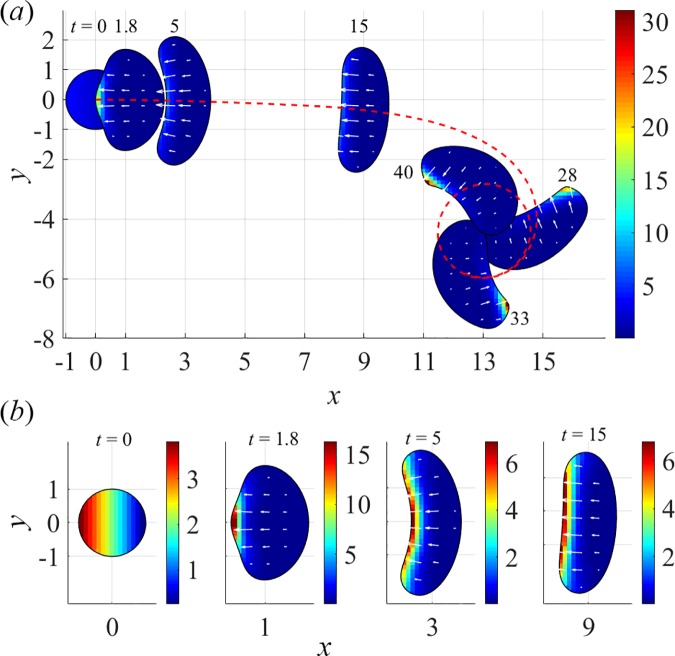
Fig 6. Onset of steady rotations in ZV model, (v0, μtot, α) = (12.5, 2π, 1).
(a) Entire cell trajectory and cell centroid track (red dashed curve). (b) Snapshots of transient myosin distributions with individual color scales during a transient, and with white arrows representing actin velocities (S3 Movie).

