
Figure 3. Estimated Linear Trends for Symptom and Functioning Measures Based on the Mixed-Effects Model.
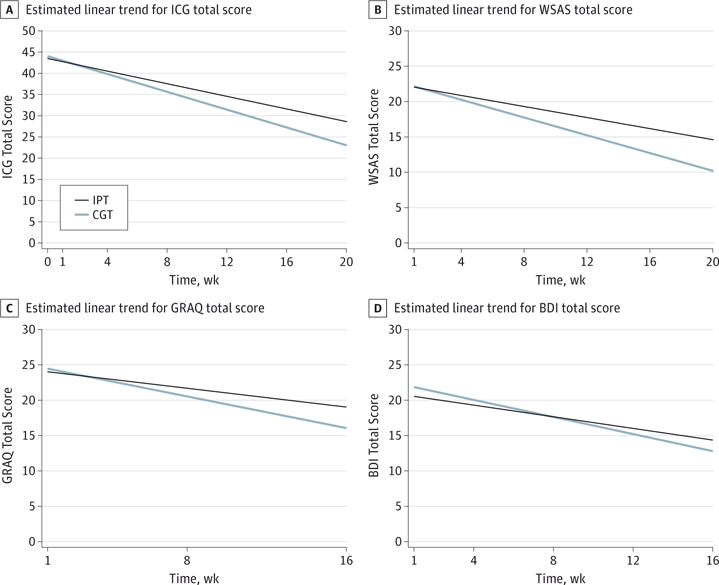
A, Estimated linear trends for mean total scores on the Inventory of Complicated Grief (ICG) (total range, 0–76). B, Estimated linear trends for mean total scores on the Work and Social Adjustment Scale (WSAS) (total range, 0–40). C, Estimated linear trends for mean total scores on the Grief-Related Avoidance Questionnaire (GRAQ) (total range, 0–60). D, Estimated linear trends for mean total scores on the Beck Depression Inventory (BDI) (total range, 0–63). Scores are totaled by study week for complicated grief treatment (CGT) and interpersonal psychotherapy (IPT) groups in the intention-to-treat sample estimated from a linear mixed-effects model with random intercepts and random slopes.