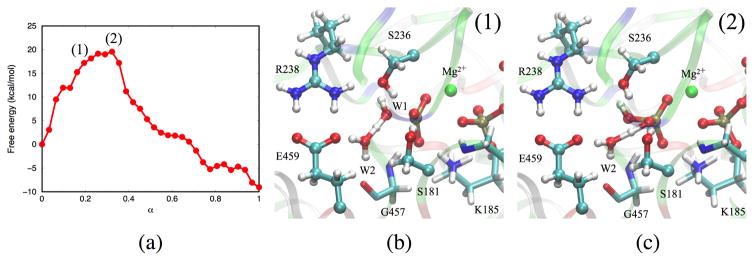
Figure 6.
(a) Free energy profile along the MFEP obtained from the W2 mechanism. Each point corresponds to an image along the string. (b) Proton transfer from W1 to W2. (c) Proton transfer from H3O+ to . Note that these structures do not represent energy-optimized stationary points but selected structures in the specific string image.

