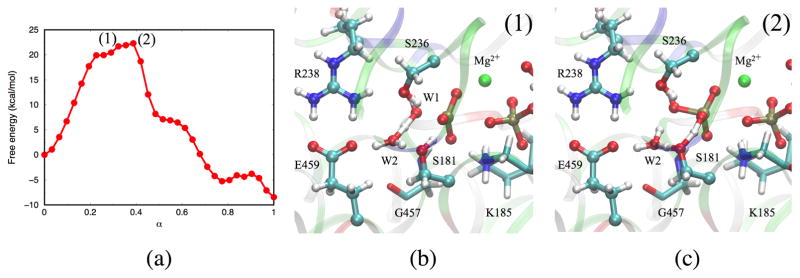
Figure 7.
(a) Free energy profile along the MFEP obtained from the W2-S181 mechanism. Each dot corresponds to an image along the string. (b) Proton transfer from W1 to W2. (c) Concerted proton transfer from H3O+ to S181 and from S181 to . Note that these structures do not represent energy-optimized stationary points but selected structures in the MD trajectories.

